In this comprehensive analysis, we’ll break down the strengths and weaknesses of Smartlook and Hotjar. This deep dive into the key features of these two leading website analytics tools will provide valuable insights to optimize your website’s performance and user experience.
So, whether you’re a marketer, product manager, or UX designer, this article will help you decide which tool best suits your needs.
Our focus will be on the two most important comparative view
- Smartlook vs Hotjar: Best Session Replay Software
- Smartlook vs Hotjar: Which Heatmap Software Wins?
- Smartlook vs Hotjar: Which Website Analytics Software Should You Choose?
So, let’s start with
Smartlook vs Hotjar session replay
Session replay features of both Smartlook and Hotjar help you understand
- How users interact with your website,
- How many people are leaving your site
- Reasons of leaving
- identifying areas for improvement,
- And troubleshooting issues that were detected.
Both applications record user sessions on your websites and provide actionable insights.
And here’s how the session replay features of Smartlook and Hotjar compare:
Smartlook session replay
Smartlook session replay feature records the session of both mobile applications and websites. Whereas Hotjar is only limited to recording website sessions, we’ll limit ourselves to comparing the web session recording for both session replay applications.
Smartlook offers session replay as one of the main features of its platform, allowing users to view recordings of individual user sessions with detailed insights.
The tool captures every user interaction on the website, including clicks, scrolls, page visits, and form submissions.
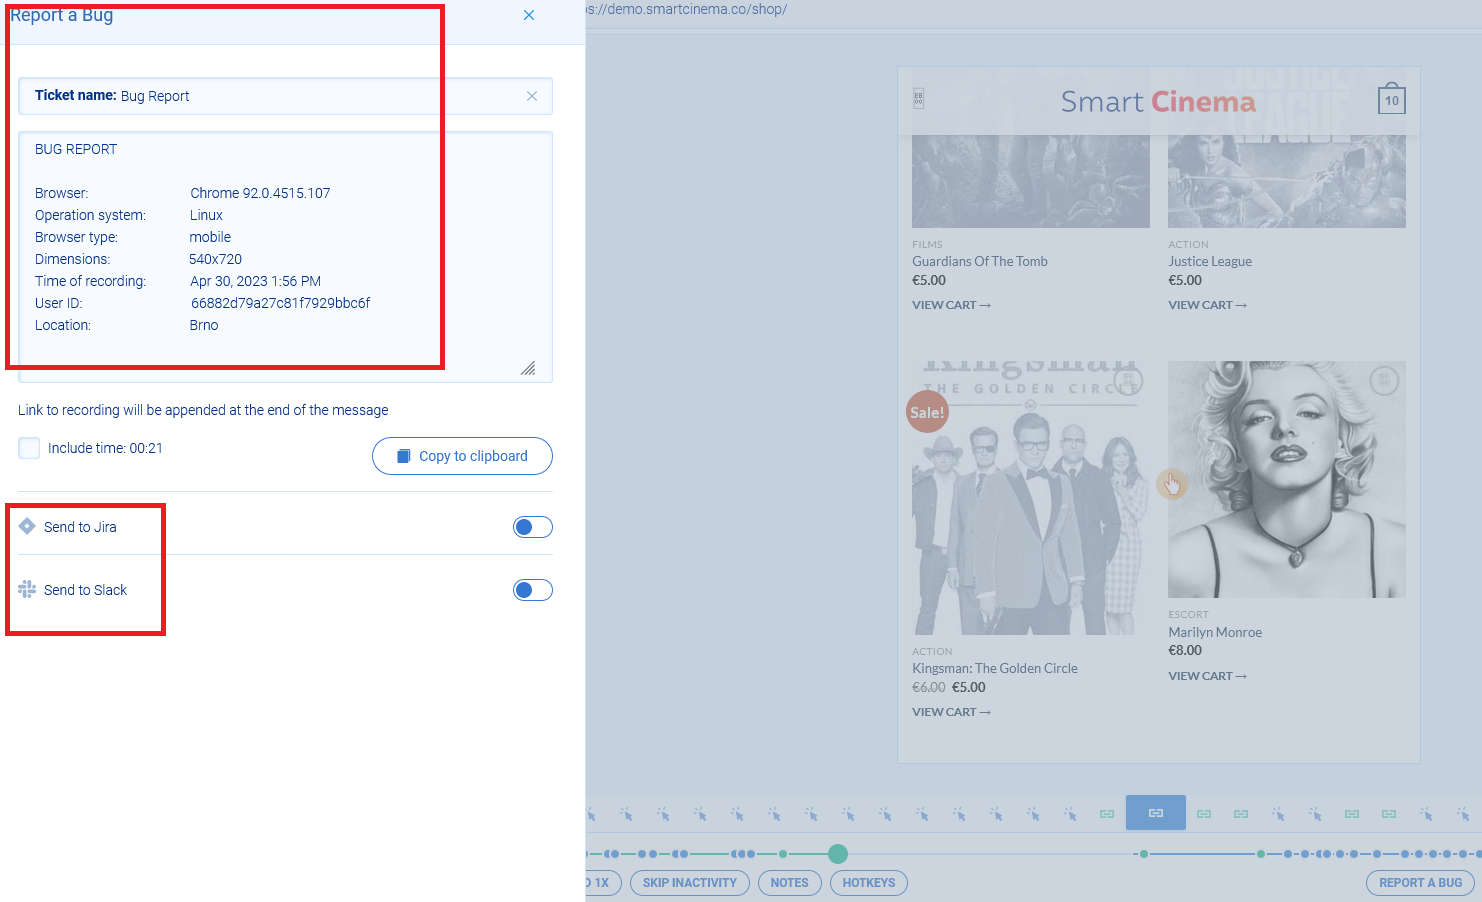
Users can view replays of individual sessions and aggregate data on common paths and behaviors. While playing sessions of each visitor, the user can take notes and report a detected bug directly to the development team on Slack, Jira, or any other tool you integrate with Smartlook.
Moreover, the session replay interface is easy to grasp on the first try. The whole events timeline is marked with colored dots that specify events. For example, the green dot means the visitor clicked at that time, or the blue dot depicts a url visit. Also, the click and url sign that runs alongside the video timeline specifies exactly which actions were taken (for example, add to cart or visit to the page, say- xyz.com/shop/sneakers).

Also, one click on the DEVTOOLS button lets you see additional technical information about a visitor’s sessions, including all the logs, errors, warnings, info, and debugging in a single place. This dev tools panel lets users inspect the website’s CSS, HTML, and JavaScript code to identify bugs and optimization opportunities.
On a broader level, this feature helps identify performance bottlenecks of the website, diagnose issues with third-party plugins or scripts, and, most importantly, keep optimizing the website for different browsers or devices.

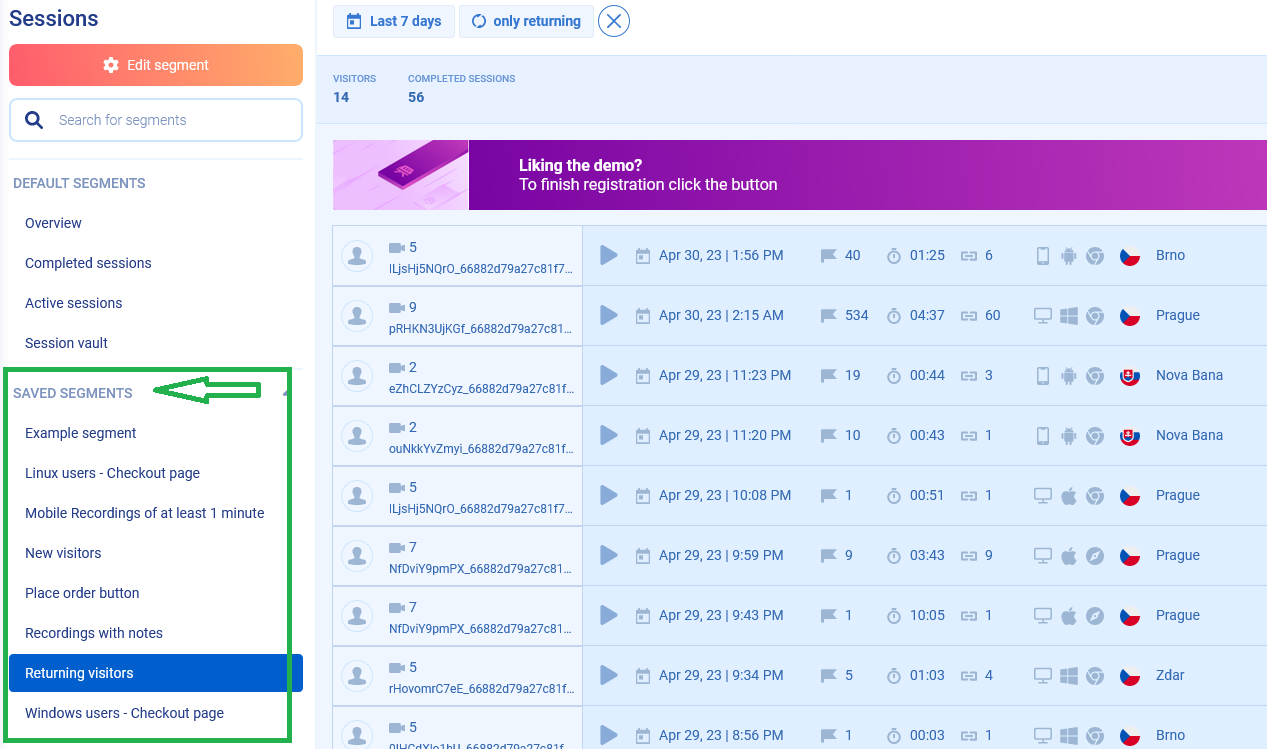
Further, apart from the default session segmentations, Smartlook allows you to segment visitor sessions (or a part of it) based on various parameters- New Visitor, Place order button, Recording with notes, Linux users Checkout page, Returning visitors, and more.
Hotjar Session Replay
Our other season replay software, Hotjar, offers session replay as a core feature. Like Smartlook, the tool captures user interactions, including clicks, mouse movements, and scrolls, and allows users to filter recordings by date, device, and other criteria.
However, the horizontal event timeline feature of Hotjar’s playback viewer gives the user more functionality than Smartlook. It shows more specific event types that happened during the event. For example, apart from the basic click and new page visit, the event timeline of Hotjar shows events such as resized window, rage clicks, Typing/Changed field value, U-turn, feedback survey, and answered survey.
Moreover, you can see these events through a beautiful visual display in the session info tab of Hotjar.

Whereas the playback toolbar has equal capabilities to Smartlook- skipping inactivity and adding highlight/comment (Note in case of Smartlook). The console is similar to Smartlook’s DEVTOOL feature, which helps find errors.
However, there are some features, such as spotting user interaction in websites with read lines and keystroke data collections (if you allow certain fields), that make it easier to grasp
- What user clicks on
- Where they focus
- What they skip
- Which section do they spend the most time in
So, in the case of this Smartlook vs. Hotjar user tracking, Hotjar has an edge over Smartlook for analyzing the recorded sessions to understand issues related to user interactions.
So in a nutshell, both Smartlook and Hotjar offer robust session replay features. While Smartlook offers more advanced filtering and segmentation options, Hotjar’s analytics and visualizations may be more appealing to some users. Ultimately, your website’s best choice of session replay software will depend on your specific needs.
Read: Geekbot vs. DailyBot: Streamline Your Stand-ups And Team Communication
Smartlook vs Hotjar: Which Heatmap Software Wins?
Basic Heatmap functionality
The heatmap functionality of both Smartlook and Hotjar provides visual representations of user behavior on your website (Smartlook also provides it for apps). These visuals show where users have clicked, tapped, scrolled, and moved their mouse. As a result, you can understand
- Which parts of your website are most engaging
- Which are being ignored
This information lets you use the website’s layout, content, and functionality to improve user engagement and conversion rates.
It also reveals areas of the website that are causing confusion or frustration for users. For example, a heatmap may show that users repeatedly click a button, suggesting they are having trouble completing a task.
Smartlook and Hotjar heatmap: How they compare
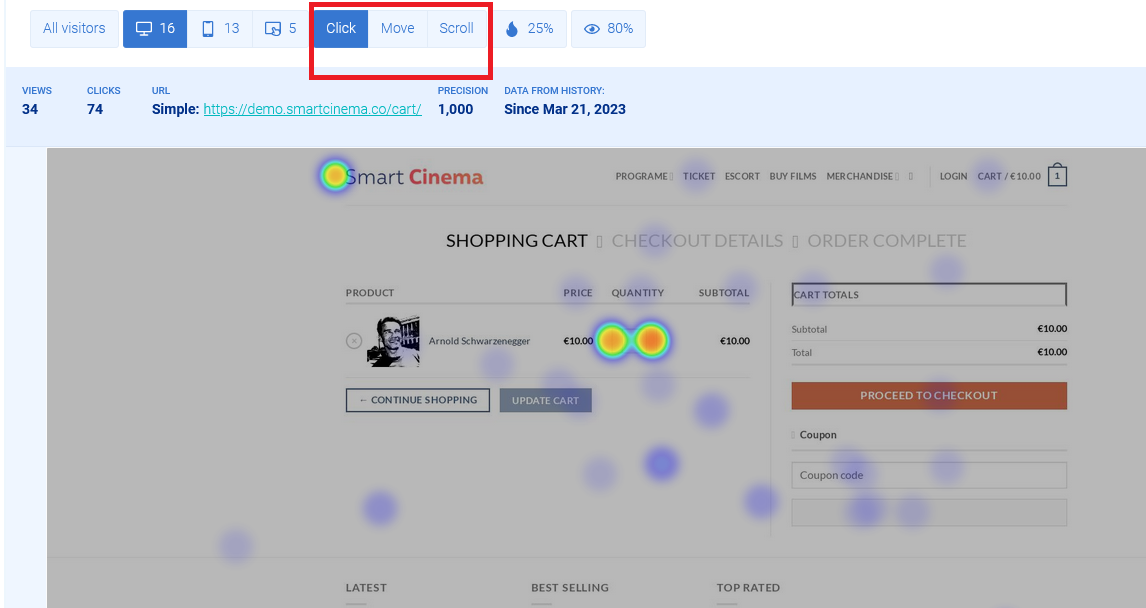
Smartlook generates heatmaps from users’ click, move, and scroll data. And you get to see those heatmaps for every website page on every screen your visitors may have used (Desktop, mobile, tablet).
The same is true with Hotjar.
But when it comes to seeing the maps, Hotjar assigns the number on various colored patches on the heat map, making it easy to comprehend the number of clicks and average scroll-past values.

Now let’s see how Smartlook and Hotjar heatmap feature compares on a granular level–
Smartlook allows you to set up a heatmap to monitor the behavior of certain segments of users based on their location, device, and other user attributes (through Identify API integration).
For example, you can set up heatmaps for users who’ve signed up in the last 7 days or customers who made a purchase of more than $300.You can create a heatmap with a similar user attribute filter with Hotjar. In both cases, you must seek the developer’s help to feed the data in Smartlook and Hotjar.
However, Hotjar provides more in-depth details than Smartlook when creating heatmaps for user behaviors, such as frustration and blockage in a funnel.
For that, Hotjar feeds the “Rage Click” and “U-turn” behavior-related data in the heatmap. Also, Hotjar allows you to create a heatmap for a relevant time period, say the last 7 days, 24 hours, or a custom date range.

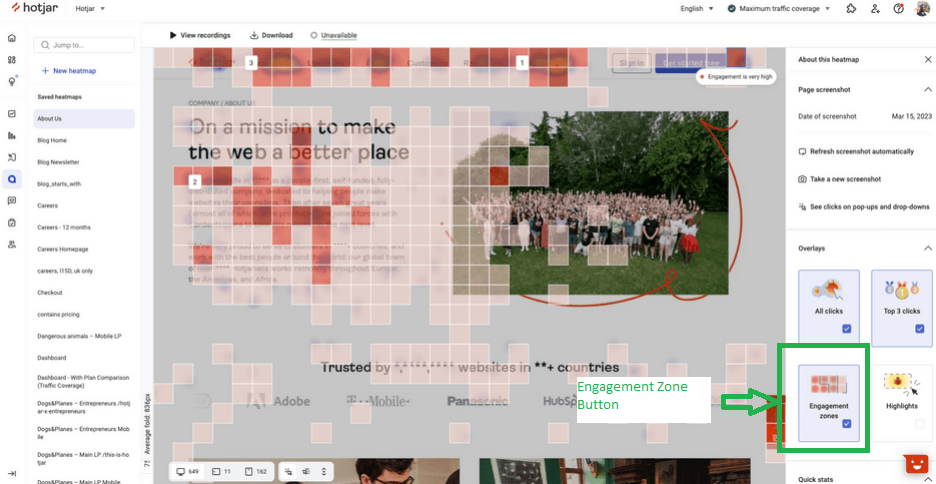
Lastly, Hotjar’s engagement zone feature uses different shades ( or opacity) to highlight the most and least engaged elements on a page. It aggregates click, move, and scroll heatmap data points. So, with a single click, you can see the areas of the page that get the most love from users and those that get the least.
These advanced heatmap features aren’t available on Smartlook. This apparently gives Hotjar an edge over Smartlook for understanding user behavior and optimizing website elements through heatmaps.
However, the choice between the two depends on how deep you must dig with heatmaps. For basic usage, Smartlook is a good option. However, more functionality demands Hotjar.
Read: 9 Best Time Clock Apps with GPS Functionalities
Smartlook vs Hotjar: Which Website Analytics Software Should You Choose?
Smartlook and Hotjar offer funnel analytics features that allow website owners to visualize conversion steps and drop-offs on their sites. However, there are some differences in the specific functionalities that they offer.
Smartlook’s funnel analytics feature allows users to set up funnels with up to five steps and segment their analysis by various attributes, such as traffic source, device, and user behavior. Smartlook also visualizes user paths through the funnel, showing how users move from one step to another. Users can then use this information to identify friction points in the funnel and optimize it for better conversion rates.
On the other hand, Hotjar’s funnel analytics feature allows users to add up to ten funnel steps based on sessions that viewed a page, clicked an element, or triggered an event. Users can also apply session filters to the entire funnel to refine their results and add up to five comparisons across any funnel view. Hotjar offers different funnel views, including a conversion over timeline chart and a metric-only scorecard. Users can also watch connected recordings for conversions and drop-offs at each step, including for comparisons.
In terms of use cases, Smartlook’s funnel analytics feature is ideal for optimizing specific user flows, such as checkout or sign-up processes. On the other hand, Hotjar’s funnel analytics feature is more suited for analyzing user behavior across the entire site and comparing performance across different segments or time periods.
Overall, Smartlook and Hotjar offer robust funnel analytics features to help website owners optimize their conversion rates. The specific choice of tool may depend on the user’s needs and the complexity of their funnel analysis requirements.
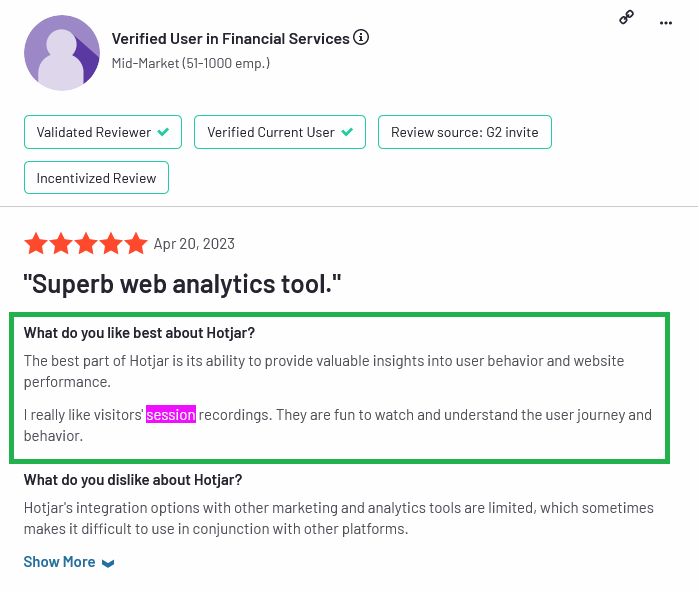
Smartlook vs. Hotjar reviews: Session recording, Heatmap, Website analytics
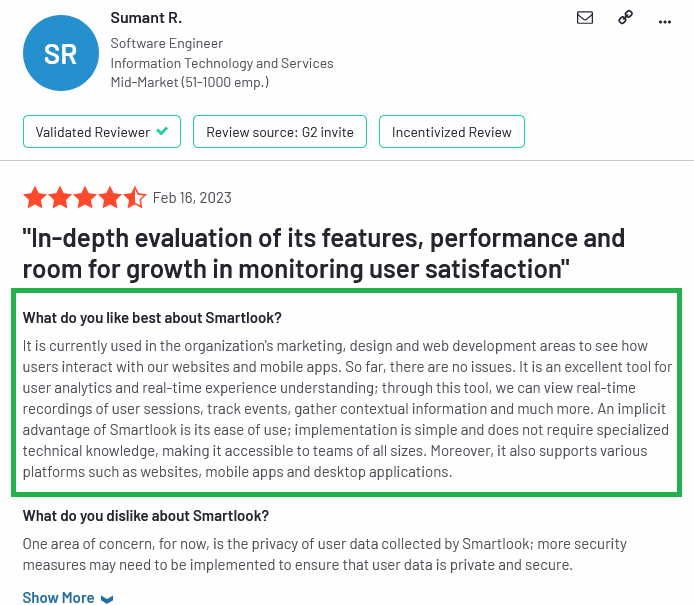
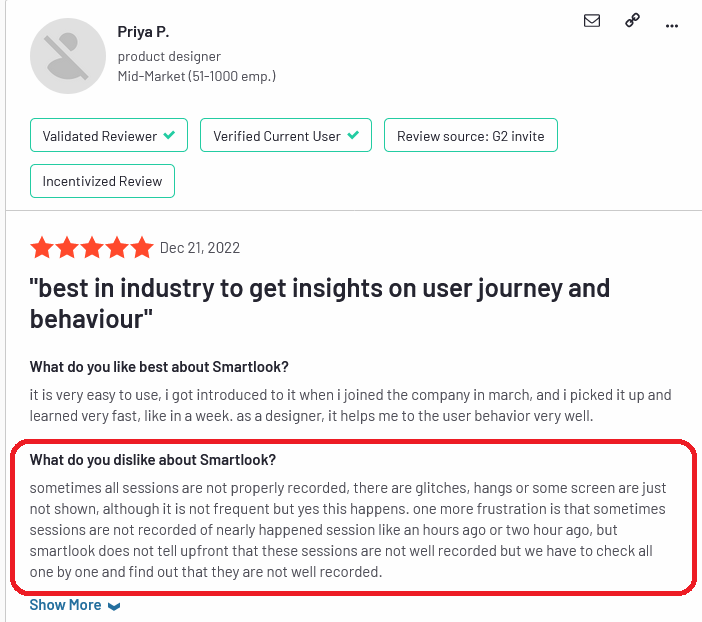
Smartlook review
Pros:
Cons:
Hojtar customer review
Pros:
Cons:

Smartlook vs. Hotjar Pricing Comparison
Smartlook comes with three pricing plans– Free, Pro, and Enterprise. The free plan can record 3,000 monthly sessions, do basic product analysis, use historical data in the heatmap, and many more. This is suitable for startups or small businesses with low budgets. However, the Pro plan enhances these functionalities.
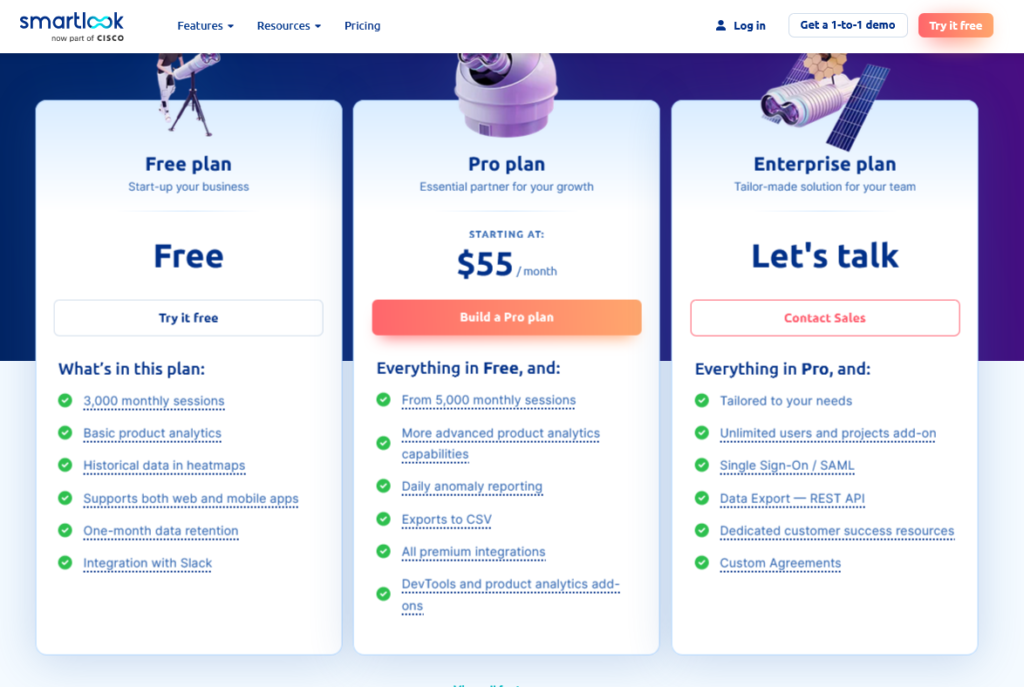
On the other hand, Hotjar pricing has four tiers: Basis, Plus, Business, and Scale.
When comparing the starting paid plan of Smartlook and Hotjar, the former provides a more cost-effective solution with more sessions you can conduct in a month or day.

Wrapping up: Hotjar vs Smartlook
In conclusion, both Smartlook and Hotjar offer a range of powerful features to enhance your website analytics. Your choice will depend on your specific needs and preferences.
Note: We might receive a small commission if you sign up for your choice of solution using the links provided.